
Let’s face it, we can’t escape data. It’s everywhere.
It surrounds our lives… every action, transaction, and interaction can be captured, stored, and analyzed. It powers our lives in unique and meaningful ways, from finance to shopping to exercise.
And businesses today can’t survive without it. Data can be used to understand all aspects of business, including market trends, product & service growth, customer behaviors, and many others.
According to a recent report on global data management, 95% of the organizations in the U.S. use their data sets and big data to understand their market and develop business strategies.
So how can businesses fully utilize their data to drive business intelligence?
Simplifying Complex Data with Visualization
A picture is worth a thousand words.
Or, in this case, a picture is worth many thousands of data entries. A data visualization tool as simple as a pie chart can help you visualize the data that would otherwise consume a massive data source such as a grid or table. Data visualization helps people understand and absorb information quickly, by making them look at the bigger picture instead of thousands of pieces of a puzzle. By looking at this bigger picture, people can easily correlate and understand the relationships between business conditions and bring them into focus. In short, data analysis and data visualization help you connect the dots in your business and your data.
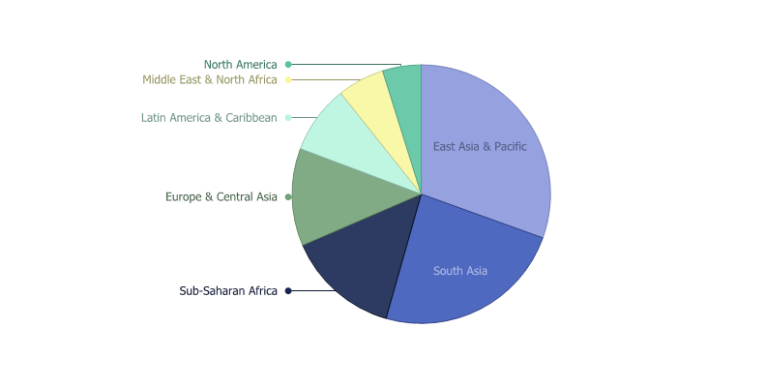
For example, this simple pie chart sums up the data about the population of the entire world and classifies it based on the region. This includes data from 195 countries and 7 continents summed up in a simple, small chart.
Easily Convey your Message
Consumers are inundated with huge amounts of information, which has made it extremely difficult for businesses to grab and hold their customers’ attention. If they manage to get their attention, it’s almost impossible to hold it for longer than a minute until they lose their attention again. With such short attention spans, it’s important to convey your message quickly and effectively.
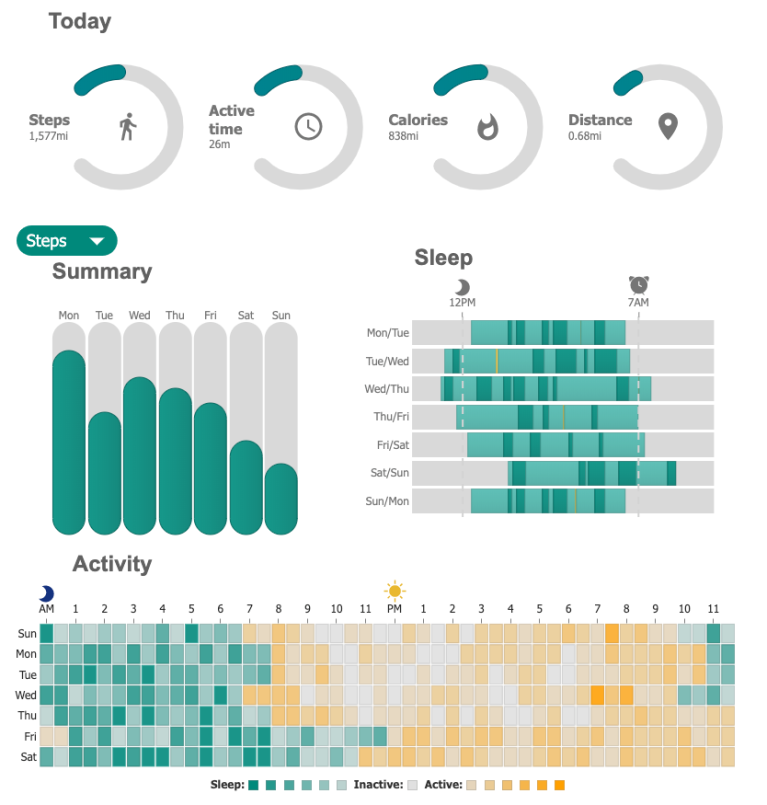
Data visualization helps you share your data and insights quickly without losing the interest of your audience. The dashboard of a fitness band application is a perfect example of this; it packs different aspects of data into amazing graphics and gives the user a clear idea of his fitness progress at a glance.
Reduce the Need for Engineers
Understanding big data just a few years ago was very difficult because organizations had to hire IT specialists to reap the benefits of big data. These IT specialists or data scientists would harvest the data from the web and work to understand the patterns. The problem with these IT specialists was that they did not know what to do with data or from what perspective to look at those trends in the big data.
Now data visualization software has made it easier for insight managers and non-technical people to understand complex data in real-time. Business users can easily develop insights according to the information available and use it to the benefit of their organizations with self-service reporting that doesn’t require data scientists to configure.
Recognize the Outliers
Data visualization helps you recognize the outliers in your data. Seeing a drop in sales and being able to jump on and address that quickly can meaningfully impact your bottom line. Conversely, seeing a jump in sales and being able to maximize opportunities for your business as they happen can have a long term positive result.
By avoiding negative impacts and expanding positive ones, paying attention to outliers in your data with business analytics can maximize your business returns and enhance data-driven decisions.
Strategize
One of the main reasons behind the popularity of big data and data visualization is that it helps pull back the veil on business data and reveal important market trends. It provides them insight into what a customer likes in their product and also enables them to learn some of the negative aspects of their products.
Data visualization helps businesses develop better strategies to improve their performance and decision making. Intelligence tools that process real-time data yield actionable insights and facilitate data exploration. Regardless of the large amounts of data in your organization, data analytics combined with interactive visualizations in your analytics platform helps key decision makers strategize and make informed decisions to drive your products forward!
Take Action
The last but most important step in understanding your data is taking action according to your understanding. Data visualization has helped us in every facet of business, from understanding the data to displaying it to building cohesive strategies. In the last step, data visualization helps you review your strategies, implement them and evaluate them over time using bespoke solutions or prebuilt BI tools – it’s never been easier to perform in-depth data discovery for your business. And if any issues are found, data visualization helps you identify them and take action quickly to get better results.


One thought on “The Importance of Data Visualization in Business”